Confusion Matrix Clearly Explained for Beginners


Confusion Matrix is a table which is used to describe the performance of a classification model on a set of data whose true values are known.

Consider the following Table


Predicted
Actual


Option 1 Option 2
Option 1 TRUE POSITIVE FALSE POSITIVE
Option 2 FALSE NEGATIVE TRUE NEGATIVE


  • The Rows in a confusion matrix corresponds to what the machine learning algorithm predicted
  • The columns correspond to the known results or the Actual Value


To illustrate consider the following Dataset.

Chest Pain Blood Circulation Blocked Arteries Heart Problems
NO NO NO NO
NO YES YES YES
YES YES NO NO
--- ---- ---- -----


So suppose based upon the dataset above Our ML Algorithm returns the results that we placed in the confusion matrix. 


Predicted
Actual


Heart Problems No Heart Problems
Heart problems 250 20
No Heart Problems 40 500

The above table or confusion matrix shows us the following

  • The Algorithm correctly predicted that 250 people had heart diseases
  • The Algorithm correctly predicted that 500 people didn’t have a heart disease
  • The Algorithm incorrectly predicted that 20 people had heart disease
  • The Algorithm incorrectly predicted that 40 People had no heart disease

Confusion Matrix can be a very important tool to compare the results of different algorithms.

Summarizing Distributions using Statistics

Summary Statistics are used to summarize information regarding a sample.

Important tools in Summary Statistics are

  1. Mean
  2. Variance
  3. Effect Size (https://en.wikipedia. org/wiki/Effect_size)
  • A histogram is a complete description of the distribution of a sample, by a histogram a complete reconstruction of the values in a sample can be reconstructed. 
Summarizing a distribution is important and descriptive statistics is used to provide a summary of a sample.

Some important characteristics are 
  • Central Tendency: Are the values around a central point,  mean, mode or median. 
  • Modes: Is there more than one cluster. ( A modal value, is calculated by counting the number of occurrence of a value.)
  • Spread of Data: How much variability is in the data. The variability in the data can be calculated by range, quartiles, variance, absolute deviation and standard deviation.
  • Tails: How quickly do the probabilities drop off as we move away from the modes ?
  • Outliers: Extreme Values away from the modes, sometimes the result of Errors but other times the result of  unusual data.

Simple Linear Regression Example in Python Machine Learning

This script is a simple demonstration of machine learning in python. This uses Linear Regression to predict pizza prices vs diameter
The LinearRegression class is an estimator. Estimators predict a value based onobserved data. In scikit-learn, all estimators implement the fit methods (used to learn the model) and predict (used to predict the value of a response variable).
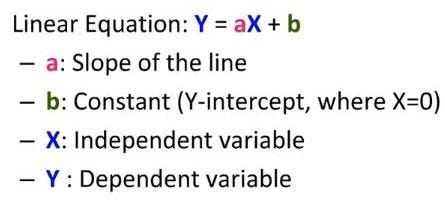
Simple linear regression assumes that a linear relationship exists between the responsevariable and the explanatory variable; it models this relationship with a linear surface calleda hyperplane. A hyperplane is a subspace that has one dimension less than the ambientspace that contains it. In simple linear regression, there is one dimension for the responsevariable and another dimension for the explanatory variable, for a total of two dimensions.The regression hyperplane thus has one dimension; a hyperplane with one dimension is aline.

Linear Regression Equation

Simple NumPy Array Tutorial

Simple introduction of Numpy

Numpy is the most powerful Python package for working with data.

Knowledge of Numpy is a must for Data analytics, machine learning. Numpy is a core library for scientific computing in Python. Its tools are used to solve computing problem (specifically mathematical models) of Science and Enginering. 

The most important aspect of Numpy is its n-dimensional array having significant advantage over Python Lists

  1. More compact 
  2. Faster access in reading and writing items 
  3. More convenient
  4. More efficient.

1. Create a Numpy Array

There are multiple ways of creating a Numpy Array
  • array()
  • ones()
  • zeros()
  • logspace()
  • linspace()
  • arange()

1.1 Creating from a Python List

# Create a one dimensional array from a list
import numpy as np
lst = [0,1,2,3,4]  #Create a List
np_arr = np.array(lst)  #Convert list to np array


1.2. Create a Two Dimensional Array(Matrix )


lst2 = [[0,1,2], [3,4,5], [6,7,8]]
numpy_2darr = np.array(lst2)


1.3. Create a Three Dimensional Array


from numpy import zeros
np.zeros((2,3,2))

1.4. Create an array using Array function 


from numpy import *
arr=array([1,2,3,4,5],int)

1.5 Create an array using linspace function


numpy.linspace(start, stop, num = 50, endpoint = True, retstep = False, dtype = None) : Returns number spaces evenly w.r.t interval.


from numpy import *
arr=linspace(0,15,5)

1.6 Create using arange function

 This is not "arrange" with double r. Its more like A Range.

from numpy import *
arr=arange(0,15,5)
arr
#will print array(0,5,10)

1.7 Create using logspace function

logspace creates array with log values. The first parameter specifies the starting point, the second ending point and the third the number of steps to reach the ending point

>>> arr=logspace(10,20,3)
>>> arr
array([1.e+10, 1.e+15, 1.e+20])

1.8 Create using one and zeros function


>>> arr=ones(10)
>>> arr
array([1., 1., 1., 1., 1., 1., 1., 1., 1., 1.])
>>> arr=zeros(10)
>>> arr
array([0., 0., 0., 0., 0., 0., 0., 0., 0., 0.])


3. Provide a datatype for the Array


numpy_arr_2d = np.array(lst2, dtype='float')


Running Drupal in Docker

I will assume that you have already installed docker. If you haven't installed docker please visit https://www.docker.com/ to download a...